
Can We Study the Most Popular Consumer Apps like Social Movements?
A working theory...

Metrics vs. Movements
Every field has its house metrics, and in consumer apps, these tend to be CAC, retention curves, DAUs, plus a sprinkling of “network effects” when the story wants gravitas. These numbers exist for good reason, since they are quantifiable signals that something is currently alive. But, perhaps they’re less good at telling us what kind of thing a consumer app can/will become.
Some apps clearly are just products. They solve a task, save a few minutes, and slot into the background of a workflow. A small handful of them, however, do something stranger. Think of early Facebook on college campuses, Instagram in its first discovery era, TikTok during lockdown — these platforms reorganized friend groups, meme culture, communication, how people saw themselves, etc. Technically, these are “just apps,” but sociologically, they catalyzed a change in society that doesn’t feel like it can be analyzed solely through the lens of “software.”
Political scientists have a term for this kind of reconfiguration that you’ve probably heard of — social movements. These researchers have spent decades trying to quantify how movements start and, perhaps more importantly, why some of them win. One of the most interesting people doing this is Erica Chenoweth at the Harvard Kennedy School (HKS). They have catalogued campaigns over the last century, and in one particularly famous slice of research, they found that nonviolent campaigns which mobilize sustained participation from roughly a few percent of the population (around 3.5%) almost always succeed in their main demands.
I’m not interested in smuggling that number straight into tech and declaring that every app only needs 3.5% of Gen Z to become revolutionary. Chenoweth is explicit that it’s an empirical pattern in one dataset, not a law of history, and later work has pushed back on people treating it like numerology. What I am interested in is the shape of the claim — that perhaps beyond some threshold, a small, committed minority can tilt the equilibrium for everyone else.
This essay is an attempt to aim that idea at consumer apps and see if it holds. In other words, could we, with the data we have, meaningfully talk about “participation thresholds” for Facebook in 2004, or for TikTok and BeReal two decades later? Is there a way to map the variables movement scholars care about (populations, active participants, committed minorities) onto social products in a way that survives contact with real numbers?
I don’t know the answer yet. But what follows is a sketch of how that mapping might work, with a couple of case studies (Facebook as a campus movement + BeReal as a “rally” that never became an organization), and a tentative research agenda for anyone who wants to treat “apps as movements” as something more than a metaphor. To end, I’ll gesture at what this might imply for founders and investors. But for now, the question is simpler — If we took social apps seriously as social phenomena, could we study them with the same quantifiable discipline we reserve for movements in the streets?
Building a Toolkit
If I’m going to borrow from social‑movement research, I should be precise about what I’m taking. Chenoweth’s work is a way of structuring data about collective action. They build datasets where each row is a campaign, and columns track things like how many people participated, how often, what tactics they used, and whether they achieved their stated goals.
The 3.5% result, as I noted above, is one slice of that research — an observed participation threshold for a certain class of nonviolent campaigns. Below “a few percent of the population” in sustained action, movements in that dataset sometimes win and often lose. Above it, they almost always win. The important part is not the exact cutoff, so much as the idea that some threshold seems to exist where a small but committed minority can force a change in outcome.
Zooming out from that single number, there are a few concepts I want to keep in my pocket:
- Population: the group whose behavior matters (a country, a city, a specific constituency).
- Active participants: people who are actually doing the thing — marching, striking, organizing.
- Committed minority: the subset that shows up over and over, often at some personal cost.
- Thresholds/critical mass: participation levels at which outcomes become much more likely to flip.
- Network position: the fact that activists, brokers, and opinion leaders matter more than a random person pulled from the phone book.
In movement datasets like the Nonviolent and Violent Campaigns and Outcomes Project (NAVCO), those show up as variables you can code and correlate with success rates. My attempt in the rest of this essay is to sketch analogous variables for social apps (populations, active users, committed cores, and thresholds) and see whether they line up with the history of some of the most popular consumer apps of our time — Facebook, TikTok, and BeReal.
Mapping movements onto apps
Now that I have the movement toolkit in hand, the obvious next step is to ask what the equivalents would be in app‑land. Basically, if a campaign is a row in Chenoweth’s dataset, what is the row for a consumer product?
Very roughly, the translation I have in mind looks like this:
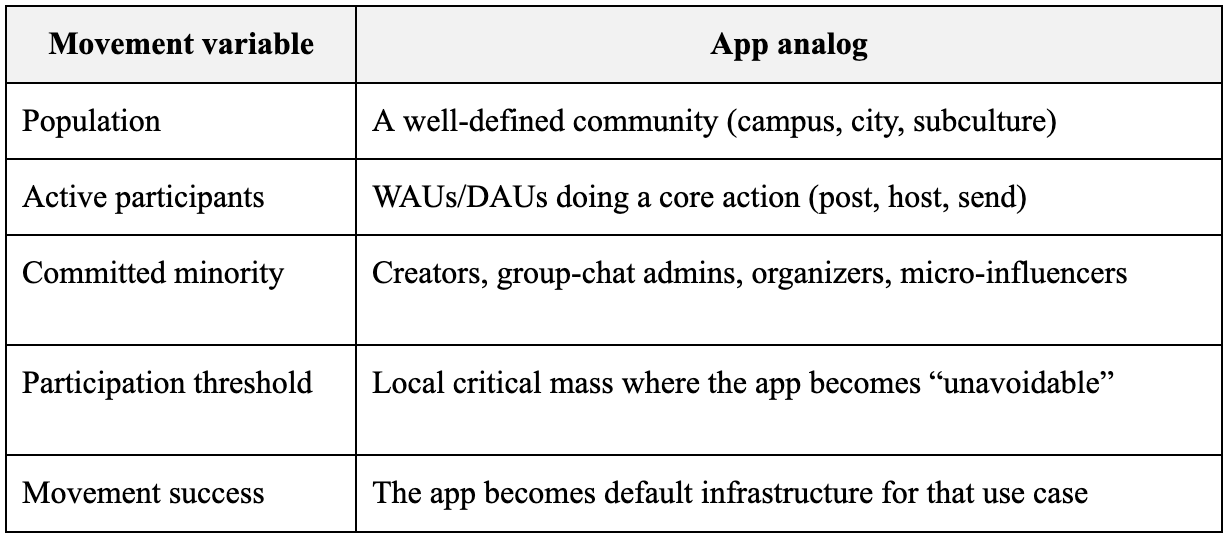
So instead of “the population of a country/city/state,” I might look at “all undergrads at Harvard,” or “teens in one city,” or “artists in a particular online scene.” Instead of “people who attend a march,” I’d track the fraction of that group who are not just signed up but actually posting, hosting, inviting, dragging friends in. Instead of asking “did the regime change?”, I’d ask “did this app become the default way this group coordinates and performs itself?”
I do not, unfortunately, have a NAVCO‑style dataset for apps. There is no public table that tells you, for each campus on earth in 2004, what share of undergrads logged into Facebook twice a day and how quickly the norm flipped. What we do have are fragments — the early histories of Facebook’s rollout, coarse user numbers, BeReal’s download and MAU curves, occasional leaked charts, and everyone’s half‑remembered anecdotes.
That’s not enough to run the full regression Chenoweth would want, but it is, I theorize, enough to try the mapping on a couple of cases and ask whether treating “apps as movements” at least lines up with the stories we already tell about them.
Facebook as a campus‑scale movement
If this mapping is going to work anywhere, it should work on Facebook in 2004 (please note — not Meta, not the global ad stack, just “TheFacebook”).
The timeline, compressed:
- Facebook launched at Harvard in February 2004 as a Harvard‑only site.
- Within the first 24 hours, roughly 1,200 students had signed up.
- Within a month, more than half of Harvard’s undergraduate population was registered.
- By the end of 2004, still operating as a gated college network, it had crossed a million registered users.
- By September 2005 (eighteen months after launch) 85% of students at supported colleges had a profile, 60% were logging in daily, and 93% at least once a month.
As a quick aside… that last set of numbers is really quite mind-boggling… 60% daily login rates among a population that had to actively choose to open a website in an era before smartphones (?!!?!?!)
Under Chenoweth’s framework, the population that matters here are the people that keep showing up through sustained, active, visible participation (as opposed to everyone that had showed up overall). By that measure, Facebook on college campuses in 2005 was like a movement that had blown past its participation threshold.
If you run the mapping specifically on Harvard in spring 2004 (see chart above for conversions), it looks like this:
- The population is a few thousand undergrads living in dense, overlapping social proximity.
- Active participants are the students logging in daily, checking profiles, updating relationship statuses, narrating their lives in real time.
- The committed minority (the equivalent of Chenoweth’s organizers and activists) are the people uploading photos obsessively, running groups, building the social graph aggressively enough that opting out started to carry a real cost.
The outcome of this is clear. Within weeks, Facebook became the default social infrastructure on that campus. What stands out, even with coarse numbers, is that this progression reads like phase change. At some point between “a few hundred users” and “half the campus,” the socially strange option flips, and it stops being weird to be on The Facebook and starts being weird not to be. That flip, where opting out costs you something, is exactly what Chenoweth’s threshold idea is pointing at.
If I had proper micro‑data (per‑campus daily active rates at weekly intervals, broken out by year of study and residential proximity), this is where I’d want to do the “Chenoweth thing” properly — estimate the participation fraction at which the norm flipped, see if it recurs across campuses, look for a characteristic range.
Since I do not have that, I’m inferring from top‑line numbers and institutional memory. However, even that feels like enough to make the claim that at the campus scale, movement mapping is coherent. A small, bounded population, a rapid rise in sustained daily participation, and a clear before‑and‑after in what counts as normal.
The question that my next case study (BeReal) will complicate is whether scale alone can create that pattern instead of just mimicking it superficially.
BeReal as a Stress Test for my Theory
BeReal launched in 2020 but exploded into culture in 2022 on quite a novel premise: once a day, at a random time, you had two minutes to post an unfiltered dual-camera photo. No filters, no follower counts, no performance, and a deliberate correction to the exhausting theater of Instagram.
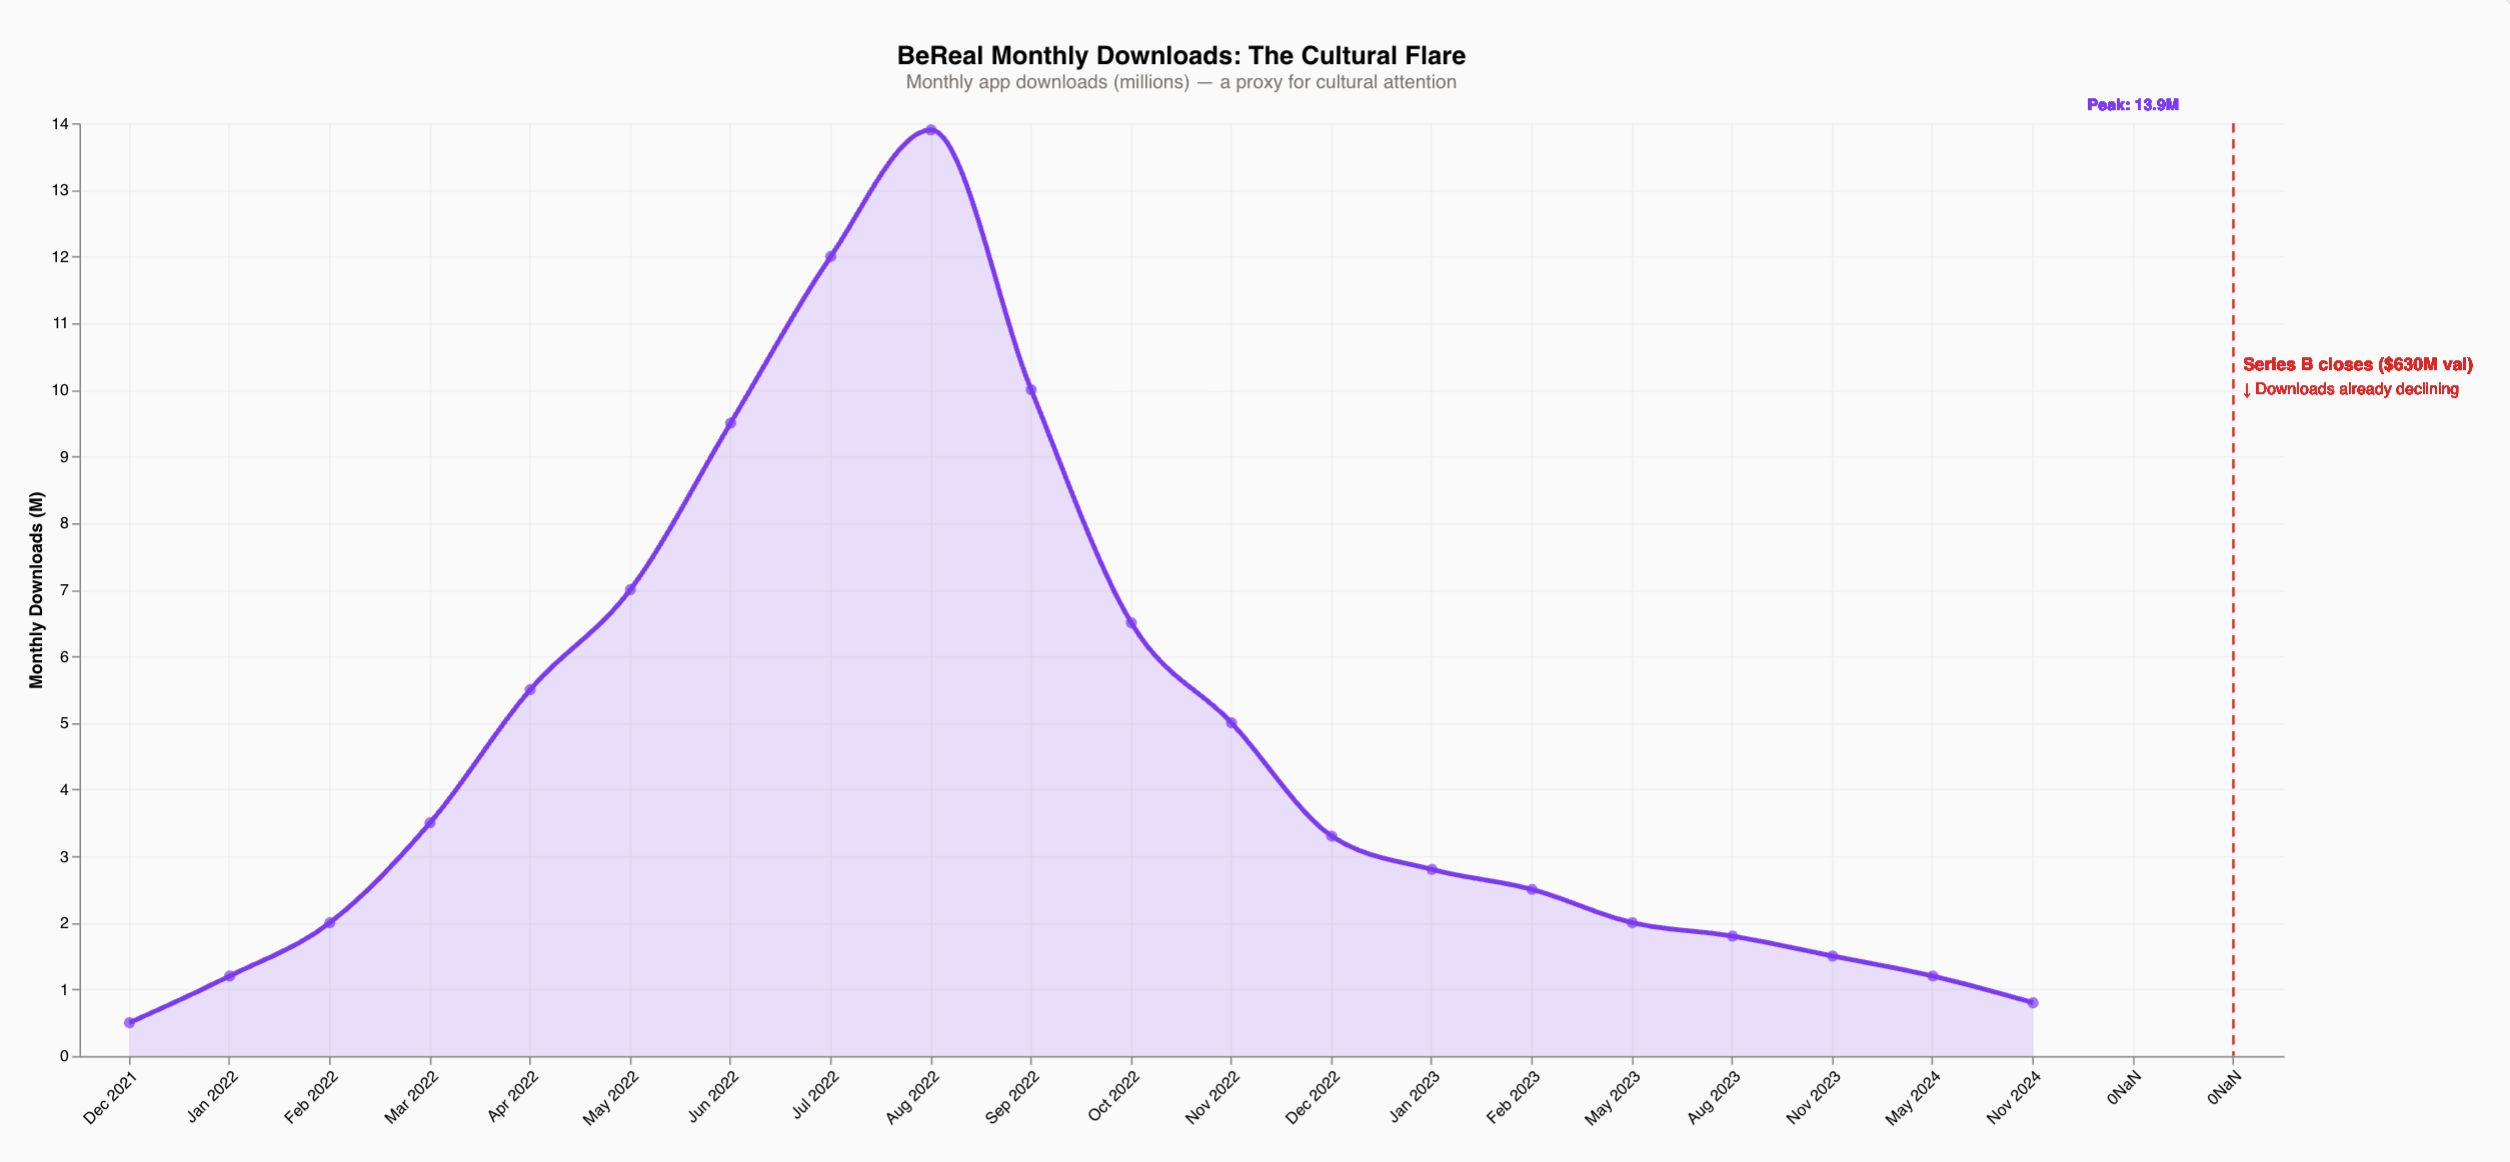
The download curve tells the first part of the story. Downloads peaked in August 2022 and were already visibly declining by September, and yet DST Global led the $60M Series B at a $630M valuation in October 2022, after the leading indicator had already turned.
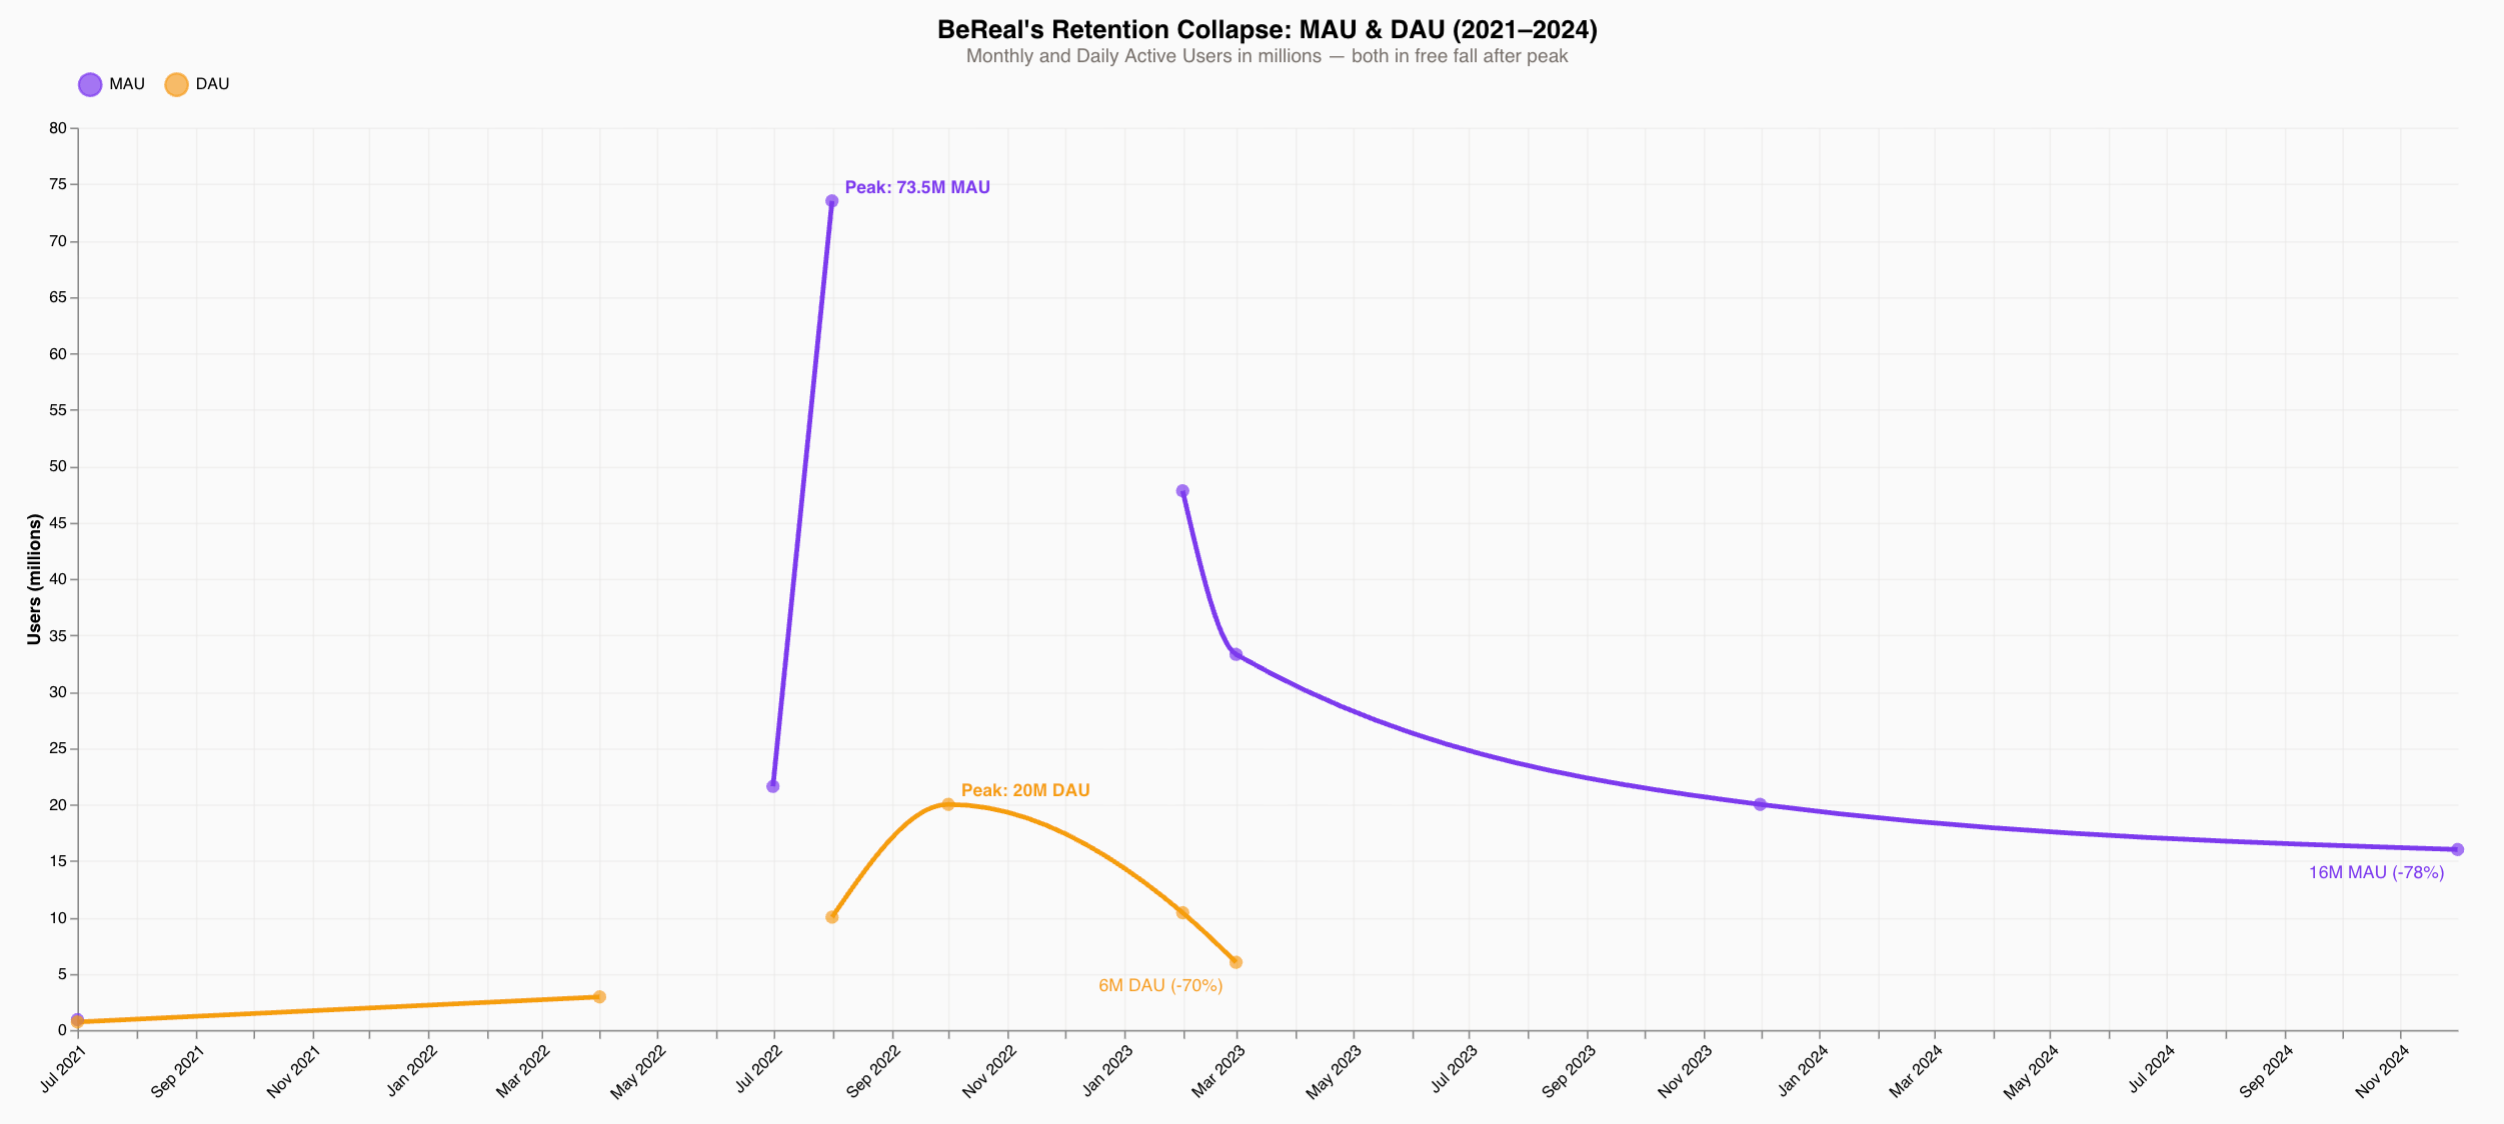
By August 2022, BeReal had 73.5 million monthly active users. Daily actives hit 20 million in October 2022, the same month the Series B closed. By February 2023, just four months later, DAUs had dropped 48%, from 20 million to 10.4 million. By March 2023, DAUs were at 6 million, a 70% collapse from peak in five months. By the end of 2024, monthly actives had fallen 78% from their high, settling around 16 million.
And through all of it — through the cultural explosion, the tier-one fundraises (a16z + DST), and App Store dominance, BeReal generated exactly zero dollars in revenue. At the time of the Series B, the company had explicitly stated it had no plans to monetize. At acquisition in June 2024, it was still at zero revenue, burning roughly $3 million a month. When Voodoo bought it for a headline €500M (~$537M), two-thirds of that price was structured as contingent earnouts tied to future performance targets for a product in freefall. The guaranteed cash component was closer to €166 million on $91.8 million raised.
The most analytically useful number in all of this is not the MAU collapse, but the DAU/MAU ratio at peak. In October 2022, BeReal had roughly 20 million daily actives out of 73.5 million monthly actives (a ratio of about 27%). Compare that to Facebook on college campuses in 2005, where 60% of registered users were logging in daily. Even at its cultural apex, only about one in four BeReal users was showing up every day. In other words, our committed core, relative to total reach, was always thin.
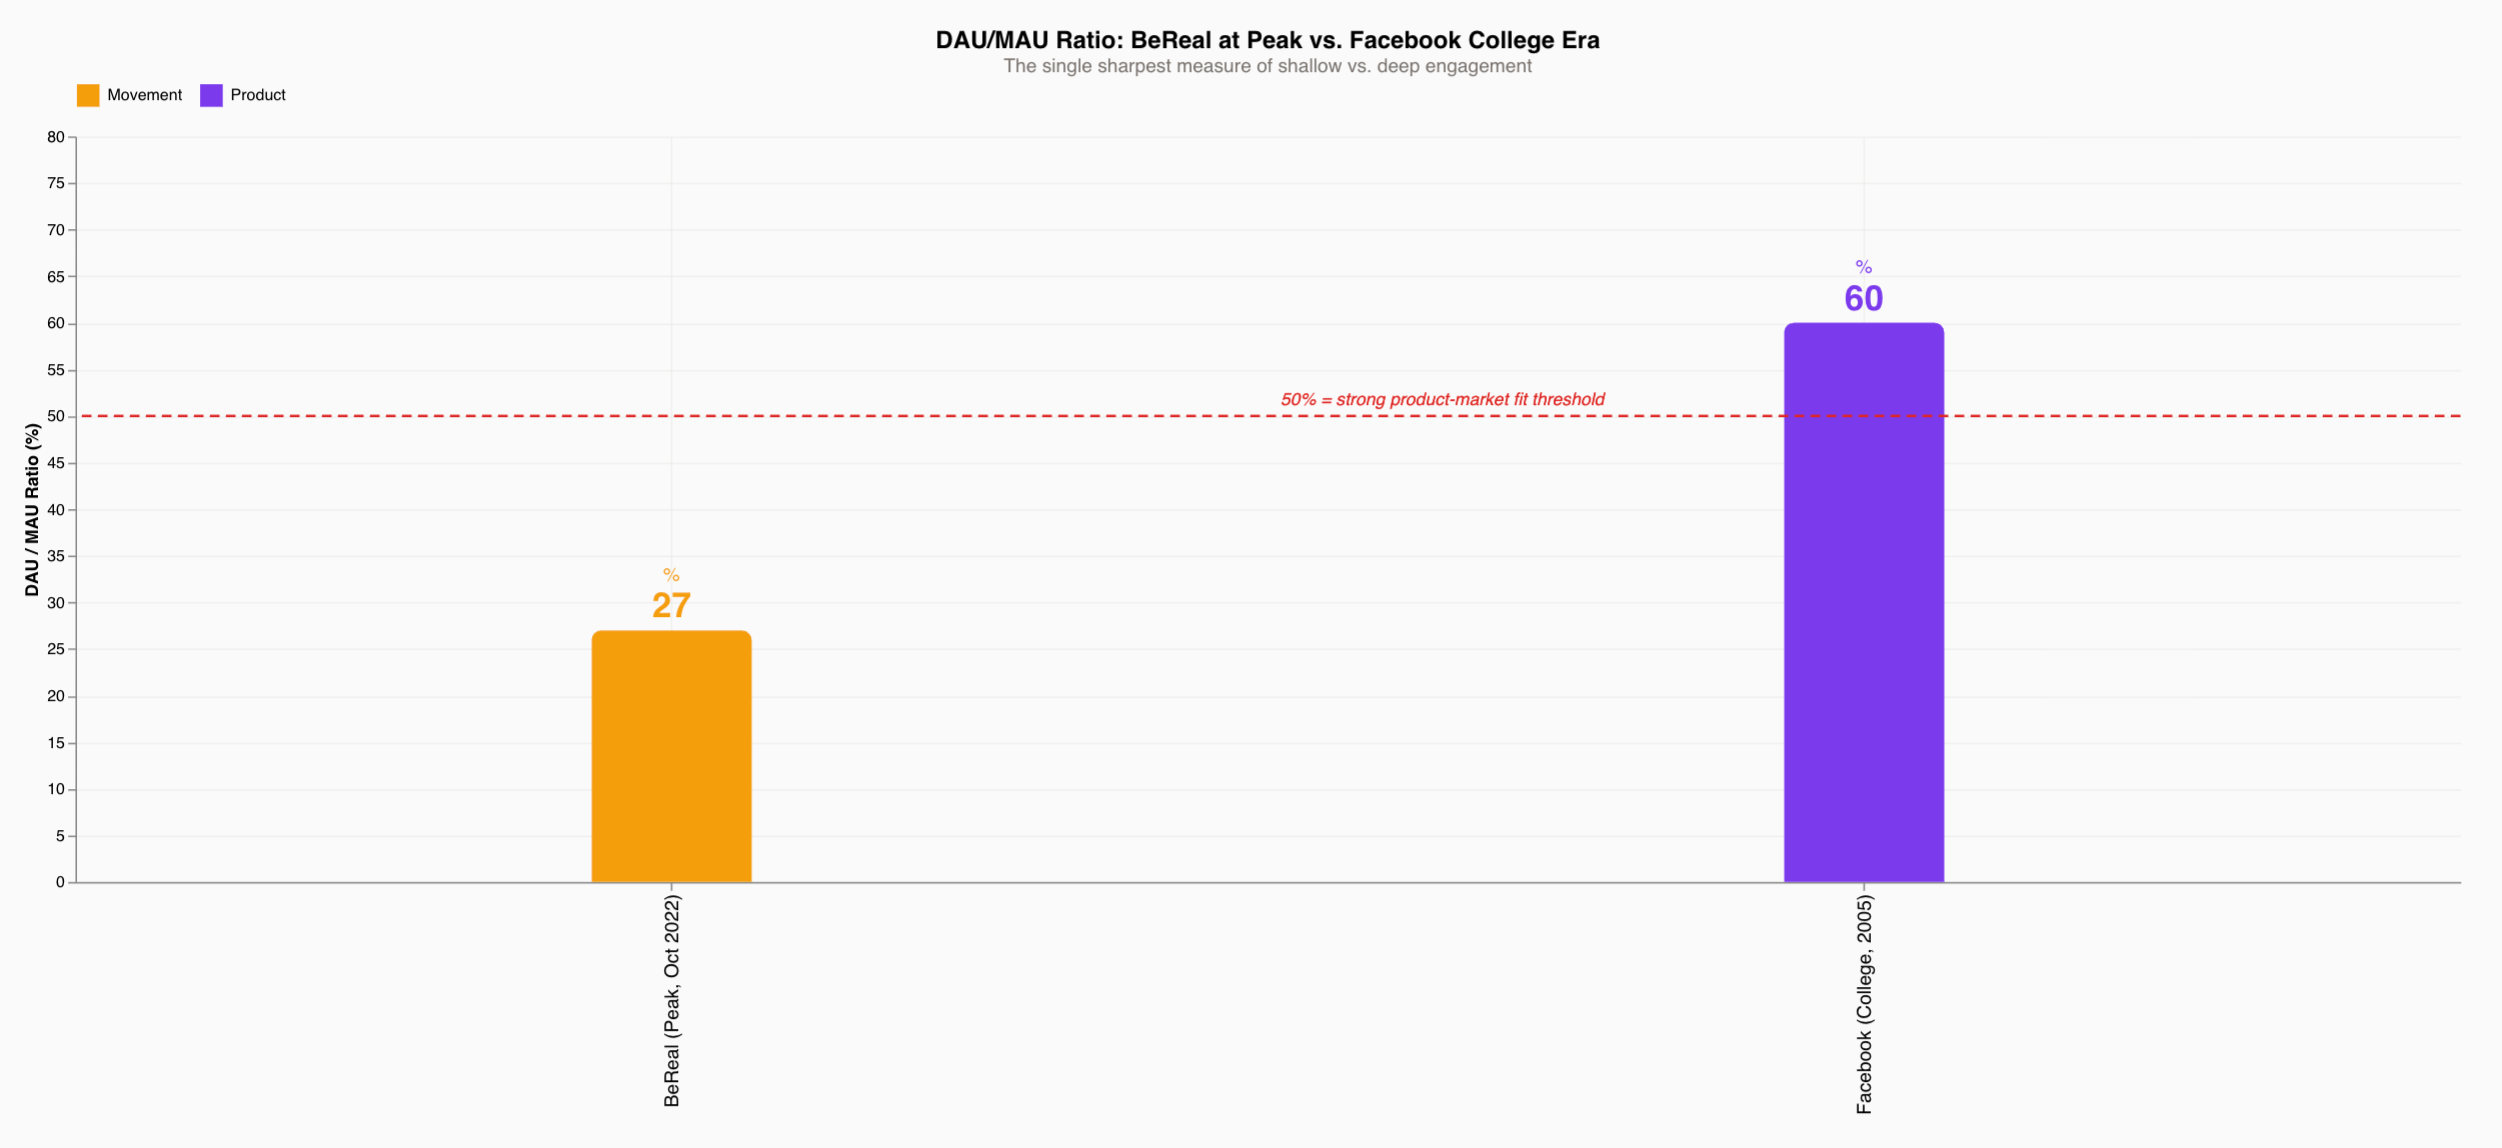
In Chenoweth’s framework, this is the crucial distinction. Recall that the 3.5% does not track how many people have ever attended a rally, it instead cares about/tracks who keeps showing up, repeatedly, and at some cost to themselves. A movement with enormous one-off turnout but weak ongoing organization is categorically different from one with a smaller but deeply committed base. BeReal got the former and Facebook got the latter.
The structural reasons for this are not hard to find and, lucky for me, they map almost perfectly onto what movement researchers look for when they try to explain why campaigns fizzle. BeReal never developed anything resembling a creator/influencer class (which are the consumer app equivalent of Chenoweth’s organizers and opinion leaders). The format deliberately resisted it, since BeReal had no follower counts, no algorithmic amplification, no economic incentive to be a power user. That was the aesthetic point, but it meant there was no committed minority whose identity, social capital, or livelihood depended on keeping the platform alive. Consequently, when casual users drifted, there was no backbone to hold the network together.
What standard investor due diligence saw in October 2022 was a clean story — 73.5 million MAU, 20 million DAUs, top of App Store charts, an “anti-Instagram” narrative landing at exactly the moment Instagram backlash was peaking, and a tier-one cap table (a16z Series A) to match.
What a movement-style analysis would have flagged was a different set of signals entirely — a 27% DAU/MAU ratio suggesting shallow engagement even at peak, a single mechanic with no ecosystem behind it, no content library, no creator graph, no switching costs, and sitting underneath all of it, zero revenue, zero monetization path validated, and zero reason for any subset of users to stay once their friends started leaving.
In other (more movement-appropriate) words, there was massive turnout at the peak event, but no membership organization behind it — no dues, no doctrine, and no organizers with skin in the game.
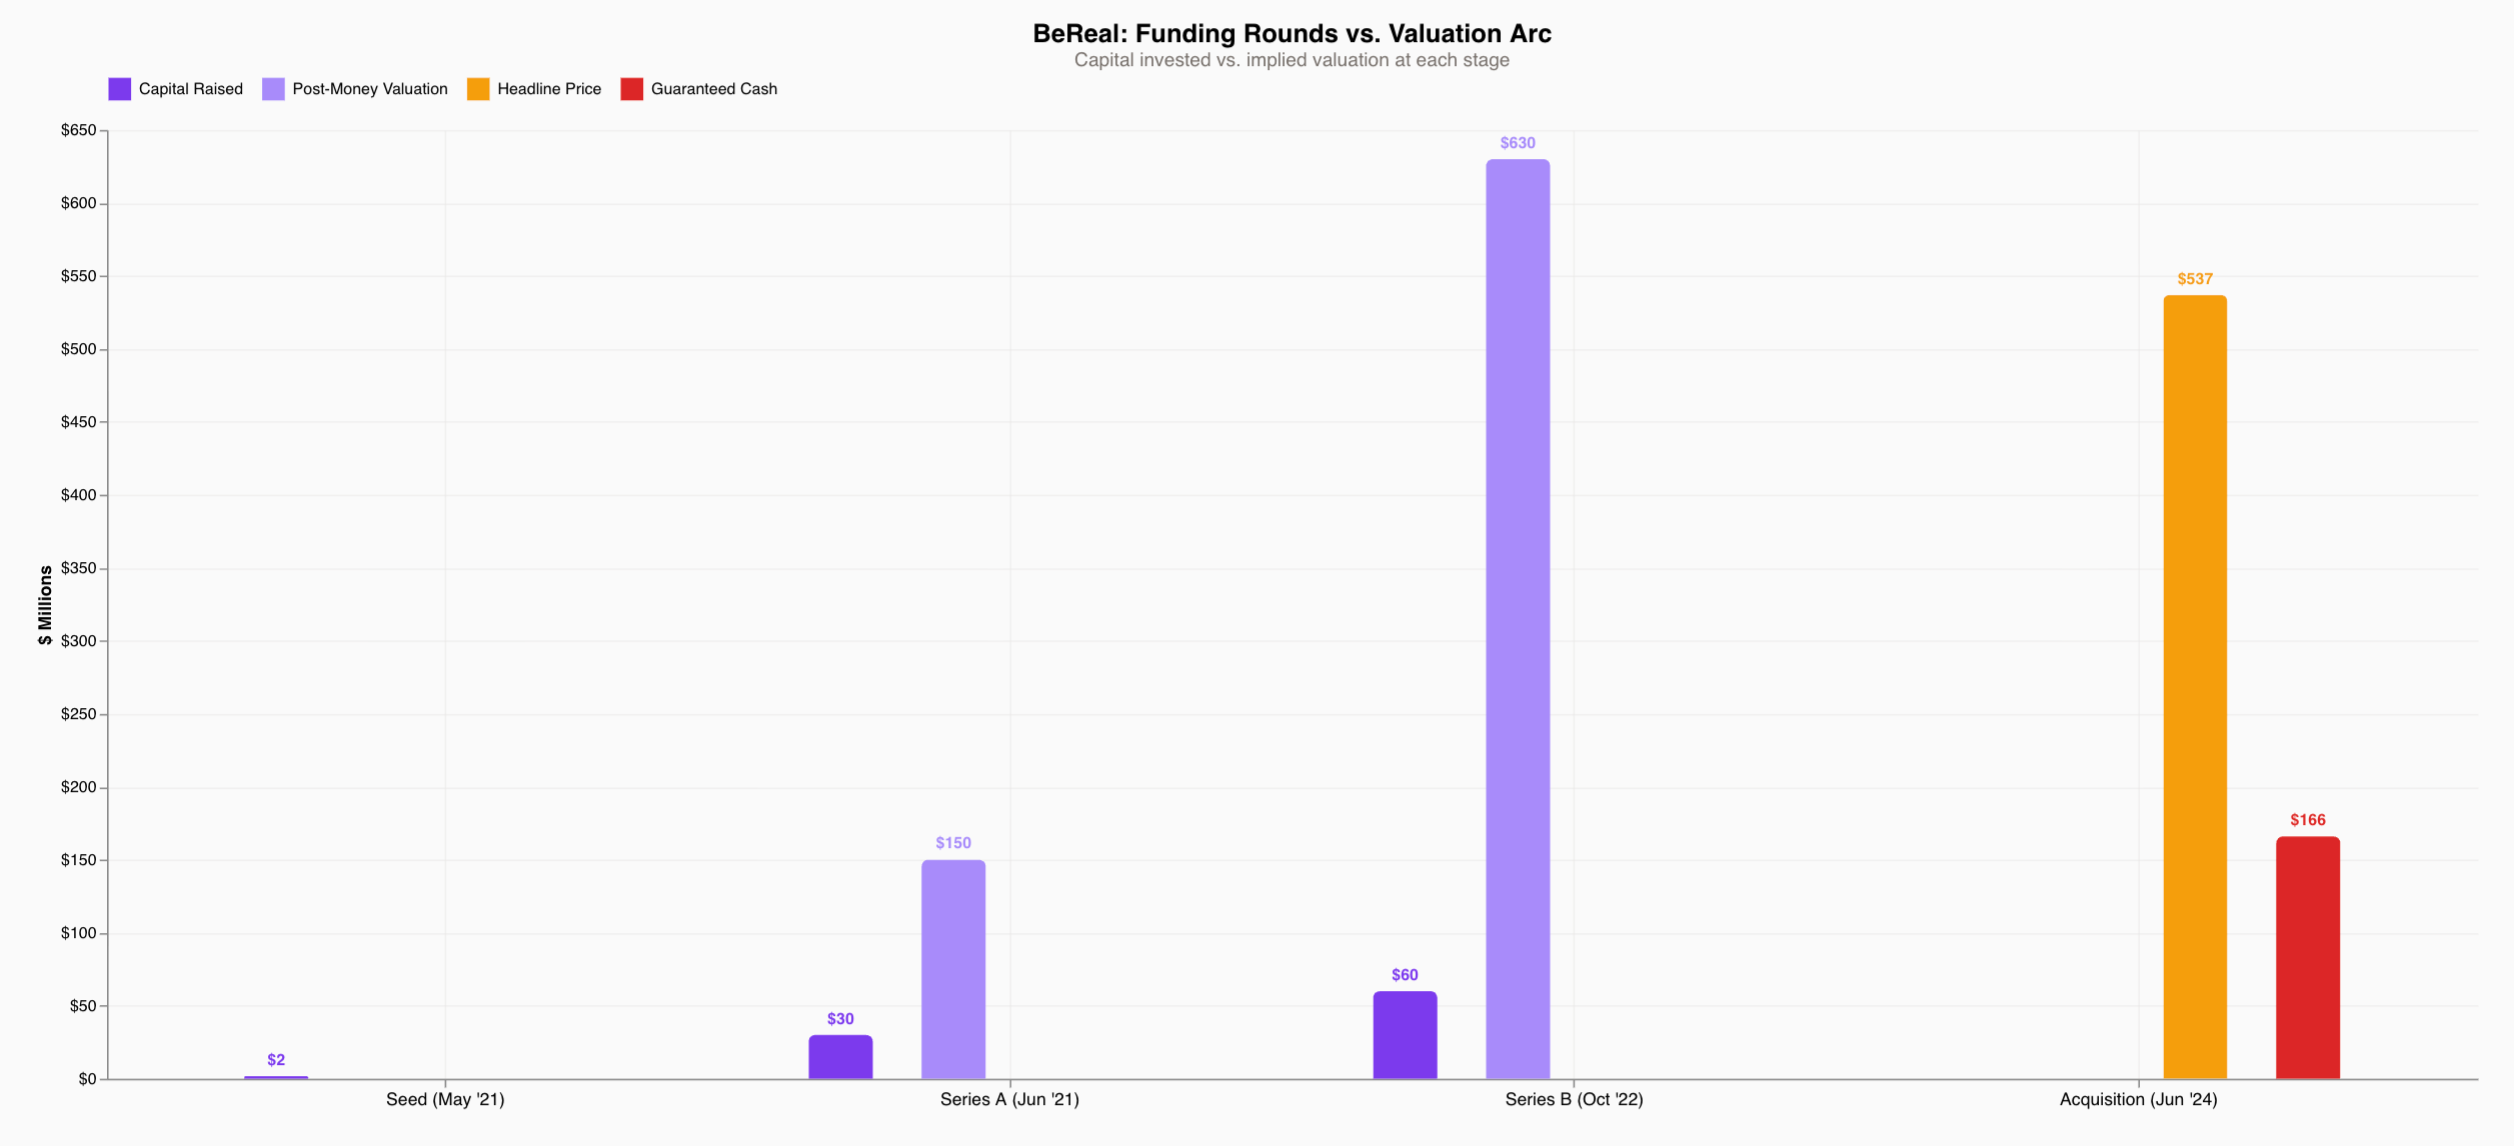
BeReal is not a story about a bad product. It’s more like “what happens when you mistake cultural virality for movement-like traction.” Because yes, the app crossed participation thresholds in raw numbers, but it never built the committed minority infrastructure that makes those numbers durable. And the market ultimately agreed — $91.8 million in venture capital, two years of peak cultural relevance, and an exit where the guaranteed cash was €166 million on a €500 million headline, with the rest tied to earn outs on a product that had already lost 78% of its users. The lesson we can draw from this is that scale without a strong core is more like a rally than a durable movement.
What a real research agenda might look like
The Facebook and BeReal cases are suggestive, but are limited by the fact that they are only two data points, reconstructed from public milestones and coarse retention curves. If the “apps as movements” mapping theory that I propose is going to be more than a useful metaphor, it needs the same thing Chenoweth’s work needed: a real dataset.
What that might look like, concretely, is something like a NAVCO for consumer apps. For a sample of social products across different categories and eras, you’d want to collect:
- Local adoption rates over time in specific communities (campuses, cities, subcultures rather than global MAU).
- Behavior depth (posting vs. lurking, invite rates, cross-platform presence).
- Network roles (who are the creators, connectors, and moderators, and how many of them are there relative to passive users).
- Outcomes (did the app become default infrastructure, stay niche, or fade like BeReal?).
This probably sounds more complicated than it actually is, and, importantly, these data sources aren’t exotic. They are comprised of app store charts, search trends, social-media mention curves, the occasional internal dataset when companies choose to publish one, and fieldwork on a handful of campuses where you could actually measure local penetration directly. With something like that in hand, you could start asking testable questions such as “do apps that become durable infrastructure show a characteristic local penetration range (say, somewhere between 5% and 15% of a well-defined community) before they lock in?” or “is there a measurable difference in network structure between durable platforms and fads, specifically in the ratio of high-engagement “activists” to passive observers?” and even “do different app categories (messaging, video, payments, social discovery) have different movement thresholds, the way different kinds of political campaigns seem to have different mobilization dynamics?”
I don’t have the answers. But I do think these are the right questions to ask, and I think they’re more likely to produce useful insight than another cohort retention table.
What this might mean for builders and investors
If the research agenda above ever produced something rigorous (a real dataset, testable thresholds, reproducible patterns across app categories) ,the practical implications would be fairly direct, even if modest.
The most useful one is probably a language shift. Right now, “traction” in a consumer pitch tends to mean MAU growth, download velocity, and maybe a retention curve if you’re lucky. A movement-style framework would push toward different questions — not just “how many users?” but “in which specific community have you become unavoidable, and what fraction of that community is doing the core action weekly?” Not just “are people retained?” but “do you have a visible committed minority (creators, organizers, connectors) whose behavior is pulling others in?” Those aren’t necessarily harder questions to ask, just questions the current metrics vocabulary doesn’t naturally surface.
The BeReal case is instructive here, not as a cautionary tale about bad investing (I am not in the position to make those claims lol), but more as an illustration of what gets missed when the only lens is aggregate growth. A DAU/MAU ratio of 27% at peak, zero creator ecosystem, zero revenue, and no switching costs were all visible in October 2022. The movement framework doesn’t require hindsight, it just requires asking, from the beginning, whether you have a core or just a crowd (or a movement vs. a rally).
A closing thought
Consumer apps are usually framed as tools or products that satisfy preferences, reduce friction, and save time. However, the most influential ones of our time have become the background infrastructure of how a generation talks and sees itself, which seems to go beyond the scope of the term “tool.” And I do not think that, in good faith, can be described as a product phenomenon. It is instead a social one.
This observation is what initially drew me to (and keeps pulling me back to) Chenoweth’s work. If a small, committed minority can reshape a society, then for any new (and “wants to be groundbreaking“ app) the interesting question is not “how many users (daily or monthly) do you have?” and more like “which few percent have actually reorganized their lives around this, and what does that mean for the rest of us?”
I don’t have a clean answer to that yet, but what I do have is a research project that I think has a compelling premise. Consider this essay the first public draft of a proposal to build something like a NAVCO for consumer apps. A real dataset, real thresholds, real patterns. I’ll be working on it. Check back in with me in a few weeks… or reach out now :)